Wednesday, February 26, 2014

THEORY OF PRICE GAPS

THEORY OF PRICE GAPS


What is a ‘Gap’ in technical analysis?

A gap is an area on a price chart in which there were no trades. It is easy to see gaps if you take candle stick charts. Let us try to understand gaps in another way. The fluctuations in stock prices are coherent in nature. That means that the price rises or falls gradually.  Thus, in rising scrip, if on one day the low was Rs 100 and the high was Rs 135, on the next day the low would be Rs 130 and the high Rs 140. Here, the low for the next day falls within the high-low range of the previous day. But suppose for the second day, the low was Rs 145 and the high Rs 150. Then, the low for the next day has fallen above the previous day High-Low range, or it was higher than the previous day’s high. So, when one draws bar charts showing High-Lows every day, there would be a discontinuity, termed as a ‘Gap’ in technical theory. An interesting feature of Price gaps is that it gets filled within a short amount of time. That is, the price would come back to fill the price gap of Rs 140 – Rs145, where there was no trade in the previous days.
In simple terms-a gap occurs when the current bar opens above the high or below the low of the previous bar. On a price chart, a space appears between the bars indicating the gap.

Types of price gaps

Gaps can be subdivided into four basic categories:
  • Common Gaps
  • Breakaway Gaps
  • Runaway Gaps and
  • Exhaustion Gaps.

Common gaps:

Common gaps are ‘common’ and ‘uneventful’. If a Gap is formed when the markets are moving in a narrow range, it is called a Common Gap.

Breakaway Gaps:

A “breakaway” gap ends a consolidation pattern and happens as prices break out. Often, they would be accompanied by huge volumes. Break-out Gaps are generally not filled for a long time, i.e. in the case of an uptrend, the price does not fall back to wipe off the gains. They may be filled as and when the prices retrace after a substantial up move. If the breakout happens to be a downtrend, the prices may not rise soon to wipe off the loss.

Runaway Gaps:

Runaway gaps are best described as gaps that are caused by increased interest in the stock. For runaway gaps to the upside, it usually represents traders who did not get in during the initial move of the up trend and while waiting for a retracement in price, decided it was not going to happen. Increased buying interest happens all of a sudden, and the price gaps above the previous day’s close. This type of runaway gap represents an almost panic state in traders. Also, a good uptrend can have runaway gaps caused by significant news events that cause new interest in the stock. Runaway gaps can also happen in downtrends. This usually represents increased liquidation of that stock by traders and buyers who are standing on the sidelines. These can become very serious as those who are holding onto the stock will eventually panic and sell – but sell to whom? The price has to continue to drop and gap down to find buyers. So, in either case, runaway gaps form as a result of panic trading.

Exhaustion Gap:

An “exhaustion” gap occurs at the end of a price move. If there have been two or more gaps before it, then this kind of gap should be regarded very skeptically. A genuine “exhaustion” gap is filled within a few days to a week. It is generally not easy to distinguish between the Runaway and Exhaustion Gaps. Experience in reading charts will help in due course. The best clue available is that Exhaustion Gaps are not the first Gaps in the chart, i.e. they follow the Runaway Gaps and usually occur when the runaway Gap is nearing completion. Exhaustion Gaps do not indicate whether the trend will reverse, they only call for a halt in the price movement.
This completes our discussion on gaps. I hope it has filled in some gaps in your trading knowledge. Here are some additional hints :-
  • A gap has relevance only to a daily or short term trader.
  • On spotting a gap in a daily chart, immediately question yourself as to which of the four kinds of gaps it is.
  • Generally, short-term trades should be in the direction of the gap. The larger the gap and the stronger the volume, the more likely it is prices will continue to trend in that direction.
  • A “breakaway” gap provides an immediate buy point, particularly when it is confirmed by heavy volume.
  • The third upside gap raises the possibility of an “exhaustion” gap. Traders should look for the gap to be filled in approximately one trading week. If the gap is filled and selling pressure persists, then that issue should be shorted. If the gap is the third one to the downside, then traders should be alert for a buy signal.
  • Gaps are powerful signals to make profits if used intelligently. They should not be acted on in isolation. View the gap within the context of the other technical results.

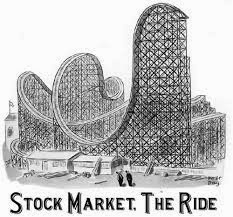
Stock markets – risky; isn’t it?

Stock markets – risky; isn’t it? 


  You’ve probably lost lot of money in it and may be you have lot of friends who have also lost a couple of lakhs in it – right? But, think again -How did you lose money? You were afraid of venturing in it on your own; hence handed it over to “experts” or you took advice (a.k.a “tips”) from your broker, neighbor…Etc… Without learning the basics.

 The dangers of investing recklessly..

Investors should be aware of risks that accompany when you take uninformed decisions with your hard earned money. Share prices can rise and fall rapidly and it can even wipe off your capital in no time, directly affecting your wealth targets and indirectly-even your family and health. Most of the risks involved with stock investing stem from poor research on the part of the investor. Share trading advice from your friend or next door neighbor are unlikely to be properly researched, therefore if you blindly act on such tips you have only yourself to blame.
Value the shares and buy it at the right price.
You need to buy a stock at the right price. By paying close attention to the price you pay for a stock, you minimize your risk, which helps maximize your total returns. If you find great companies, value them carefully, and purchase them only at a discount to a reasonable valuation estimate, you’ll be fairly well insulated against the vicissitudes of market emotion.
Buying a stock at the wrong price leaves a very bitter aftertaste, so much so that one may vow never to enter the stock market ever again. If you look at the past data, you’ll see that the stock market has given many opportunities to buy wonderful shares at throw-away prices; it has also given opportunities to sell your holdings at unbelievably high prices.
Why valuation is the Key.
Knowingly or unknowingly, you’ve valued everything you bought. Your house, your car.. You bought it after considering whether it’s really worth at that price. Dint you put in your best efforts to see that you get it at the lowest price possible? Then why not investments?
Intelligent investment needs a lot of effort. If you want to invest in stocks, the first thing to look out for is its valuation (and not whether the Sensex is moving up or down!). Stock valuation is the tool for picking out stocks that will bring you good returns. Valuation of a stock means the price or `actual’ value it holds.
Owning stocks of a company  grants you claim on everything that the company owns. So, assessing the value of the company, the profit it is generating and how beneficial it can prove to you, is a worthwhile enterprise. Valuation can prove to be especially beneficial for middle class investors, as they have limited resources to overcome losses incurred in the stock market.
Hence, valuation can be considered the key factor in buying stocks. Just as one assesses the value of anything one buys on the basis of a specified standard, stocks too need to be valued to determine whether the investment will bring you returns or not..

Highest INTEREST RATES on FD(fixed deposite)

Highest INTEREST RATES on FD(fixed deposite)


Hi there,
This post is in response to a reader’s enquiry about the best interest rates for fixed deposits in India right now.
Here are the details-
BELOW 1 YEAR
  • South Indian bank – 10% for 300 days. For senior citizens, 10.50%.
ABOVE 1 YEAR BUT LESS THAN 2 YEARS
  • Lakshmi Vilas bank – 10.50%. For senior citizens, 10.75%
  • Tamilnad Mercantile bank – 10.25%. For senior citizens, 10.50%
  • The Ratnakar bank – 10%. For senior citizens , 10.50%
  • Karur Vysya bank – 10%. , For senior citizens , 10.50%
  • Catholic Syrian bank- 9.90%. For senior citizens , 10.40%
  • City union bank -10%, For senior citizens, 10.25%
ABOVE 2 YEARS BUT LESS THAN 3 YEARS
  • City Union bank – 10% , For senior citizens, 10.25%
  • Catholic Syrian bank – 10.25%.For senior citizens,  10.75%
ABOVE 3 YEARS BUT LESS THAN 5 YEARS
  • Dhanlakshmi bank – 10.10% , For senior citizens 10.60%
  • Tamilnad mercantile bank – 10% , For senior citizens 10.25%
ABOVE 5 YEARS
  • Tamilnad mercantile bank – 10% , For senior citizens 10.25%
  • Catholic Syrian bank – 10%. For senior citizens , 10.50% ( For 91 months)
I hope the information is useful.
Have a nice day !!

SBI - SHOULD YOU INVEST IN THIS STOCK?

SBI - SHOULD YOU INVEST IN THIS STOCK?


There are lots of queries about the valuation of SBI – India’s largest bank by any parameter. The ‘SBI group’ which consists of many subsidiaries and joint ventures both from banking and non banking sectors is the largest loan provider for people and business in India.
According to the SBI’s website (which is not updated) the bank has 4713 branches in India, operates 21,000 ATMs and has 180 offices in 34 countries as on June 30th 2011. Logically, the bank holds high amount of CASA (Current Account Savings Account) deposits which carries lower interest liability. This has helped the bank to give loans at the most competitive rates in India.

Two main drawbacks: With the deregulation of savings bank interest rates by the RBI, the bank will be under pressure to pay better rates of interest to keep its customers happy. Banks like Yes bank are already giving 4% or more for money deposited in savings bank account. To be in the race, SBI will also have to pay high interest for their CASA deposits. In short, from now on, what was considered as the greatest advantage of SBI would turn out to be It’s greatest disadvantage.
The second factor that may work against this huge bank is that the new banking license norms would bring in more players into the banking sector which would initiate cut throat competition in the banking sector (Something similar to the tariff war we saw between telecom companies). How far SBI is prepared to face this remains a big question.
More number of branches also means that there is a huge number of work force to be maintained and of course, high operating expenses. The last few years’ financials also show questionable asset quality.

Two main advantages: first, size. With many subsidiaries and a variety of financial services under its kitty (insurance, mutual funds, merchant banking, credit cards, factoring, stock broking, pension fund management etc) and with spreading business in every nook and corner of India, it would be hard to beat this bank in terms of revenues.
Second – Government of India’s holding of approximately 60% in the bank. SBI always stands in an advantageous position with the government being its main promoter.

Our suggestion: Looking at the financials of the bank for the last 6 years, we estimate the bank’s share value at Rs 2450. So, to buy the stock for long term the stock must be bought only at 30% discount or below. That means, at Rs 1700 and below. At the current market rate (Rs 2205) the stock is in midway between the value zone and over priced zone and hence, we do not suggest exposure in this stock for the long term. The current momentum many take the stock beyond Rs 2450 which means that the stock has the capacity to generate approximately 10% to 15% return.

This is our suggestion. Readers are welcome to share their thoughts for the benefit of others

stock picks for MARCH

Stock picks for MARCH


Now that the finance minister has made his move, the stock markets have responded with a crash in prices.  Now, it’s time for us to see if there are any good stock picks in the market.

Large caps:

Punjab national bank: We had recommended to buy PNB at Rs 770 and below in November 2012. The stock then rose to Rs 922.10 on 31st January 2013, giving a profit of approximately 20% in 3 months. The stock is now trading at Rs 788 and can be considered for accumulation again.
BHEL: Another stock that we recommended last time was BHEL. At the current market price of Rs 201, we strongly recommend to buy this stock which is trading at an attractive price for investors who are targeting a high return in the long term.

Sesagoa: This iron ore extracting company is going to be merged with sterlite industries and will widen it’s portfolio to include iron ore, oil, zinc, lead, silver, aluminimum, copper etc. The details of this meger are already known in the market circles. At Rs 153.80, we estimate that the stock is trading at a 60% discount compared to the value it’s going to create when the merger formalities will be completed.
NMDC: the giant iron ore extracting company currently trades at Rs 138.00. The iron ore industry is cyclic in nature and reduced demand for iron ore especially from huge markets like china has resulted in this stock trading well below its actual worth. At the current rate, we estimate that NMDC trades at 55% discount and can be considered for long term investments. The cash rich, zero debt company has also made several overseas acquisitions. As the demand for iron will definitely increase in the coming years, this stock is all set to scale highs. We recommend long term investment in NMDC at Rs 138nd below.
GAIL: Another large cap that can be recommended for long term investment is GAIL. There is steady demand for natural gas and the company is a major player in this segment. Looking at the past datas, we observe that the company has been growing at a steady pace although there is some decline in the net profits over that last few years due to debts. At the current market rate of Rs 332, long term investors can start accumulating this stock in declines. The company also aims to carry out heavy expansion plan in the coming years which means that it may resort to more debt funds for financing its capital requirements. This, if done, can further bring down the net profit of the company in the coming years. Another factor to be considered is that this stock is ideal only for long term investment since all it’s projects are long term in nature and the success of such projects may take time to reflect in it’s bottom line.

Midcaps:

Crompton greaves: we had recommended this stock earlier at Rs 113 or below. The stock now trades at Rs 94.25 and can be recommended for investment with a long term point of view.
Indian bank: Indian bank is a public sector bank which falls in the mid cap segment. It has more than 2000 branches and has major presence in south India. It also has overseas branches in Sri Lanka and Singapore. However, the revenues from overseas branches are nothing much to talk about as it represents only approximately 2% of its total revenues. The bank, which is more conservative in nature of operations, has been growing steadily in the past. At Rs 174, the stock is an attractive investment. Further declines are possible but will not be a use of worry since it’s trading at an estimated discount of 40%. The stock has the potential to move up to Rs 290 in the medium term.

Small cap:

JBF industries: JBF is the market leader in polyester chip manufacturing and supply. It manufactures a wide variety of polyester chips used in textiles, bottle, films etc. the company has so far grown at a fast pace and is poised to become the only company with a diversified portfolio in polyester chip manufacturing. Apart from its manufacturing facilities in India, it also has a manufacturing unit in UAE and it has also plans to setup a unit in Belgium by the end of 2014. When all these come together, the future of the company looks bright. However, since a lot of capital expenditure is being incurred, the company meets these requirements by raising huge debts. Increasing debts will affect the bottom line of the company and it may take some time for the company to pay off its debts. At the current market rate of Rs 105.50, the stock looks attractive for long term investment. It’s a small cap and hence, all those risks that come attached to small caps are applicable here too.
ALL THE BEST FOR THE COMING MONTH!

Monday, February 10, 2014

Understanding BSE (Bombay Stock Exchange)

BSE stock classifications


SIX HEADERS- A, B, T, S, TS and Z

Hi there ,
Do you know that he BSE classifies stocks under six headers?
The Bombay Stock Exchange classifies stocks under six grades — A, B, T, S, TS and Z — that scores stocks on the basis of their size, liquidity and exchange compliance and, in some cases, also the speculative interest in them. You can look up any stock’s grade in the ‘Stock Reach’ page in the BSE Web site, under the head ‘Group’. Alternately, you can also follow the link below:

A GROUP – HIGHLY LIQUID

  • These are the most liquid counters among the whole lot of stocks listed in the BSE.
  • These are companies which are rated excellent in all aspects.
  • Volumes are high and trades are settled under the normal rolling settlement (i.e. to say intraday buy-sell deals are netted out).
  • These are best fit for a novice investor’s portfolio considering that information about them is extensively available. For instance, all the 30 stocks in Sensex are ‘A’ grade stocks.

T GROUP – TRADE TO TRADE

  • The stocks that fall under the trade-to-trade settlement system of the exchange come under this category.
  • Each trade here is seen as a separate transaction and there’s no netting-out of trades as in the normal rolling system.
  • The trader needs to pay to take delivery for his/her buys and deliver shares for his/her sells, both on the second day following the trade day (T+2). For example, assume you bought 100 shares of‘T’ grade scrip and sold another 100 of it on the same day. Then, for the shares you have bought, you would have to pay the exchange in two days. As for the other bunch that you sold, you should deliver the shares by T+2 days, for the exchange to deliver it to the one who bought it.
  • Failure to produce delivery shares against the sale made would be considered as short sales. The exchange will, in that case, on the T+3rd day, debit an amount that is 20 per cent higher than the scrip’s closing price that day. This means unless the scrip’s price falls more than 20 per cent from the price of your sale transaction, you would have to pay a penalty for the short sale so made.
  • Even so, there will be no credit made to you in the case of substantial fall in the share price. The exchange will, instead, credit the gain to its investor fund.
  • Stocks are regularly moved in and out of trade-to-trade settlement depending on the speculative interest that governs them.

S GROUP – SMALL AND MEDIUM

  • These are shares that fall under the BSE’s Indonext segment.
  • The BSE Indonext comprises small and medium companies that are listed in the regional stock exchanges (RSE).
  • S’ grade companies are small and typically ones with turnover of Rs 5 Crore and tangible assets of Rs 3 Crore. Some also have low free-float capital with the promoter holding as high as 75 per cent.
  • Besides their smaller size, the other risk that comes with investing in them is low liquidity. Owing to lower volumes, these stocks may also see frenzied price movements.

TS GROUP – A MIX OF T AND S GROUPS

  • Stocks under this category are but the ‘S’ grade stocks that are settled on a trade-to-trade basis owing to surveillance requirements.
  • This essentially means that these counters may not come with an easy exit option, as liquidity will be low and intraday netting of buy-sell trades isn’t allowed either.

Z GROUP – CAUTION

  • ‘Z’ grade stocks are companies that have not complied with the exchange’s listing requirements or ones that have failed to redress investor complaints.
  • This grade also includes stocks of companies that have dematerialisation arrangement with only one of the two depositories, CDSL and NSDL.
  • These stocks may perhaps be the riskiest in terms of various grades accorded. For one, not much information would be available in the public domain on these companies, making it tough to track them. Second, the low media coverage that keeps them relatively hidden from public scrutiny also makes them more vulnerable to insider trading. Third, these companies already have a poor score in redressing investor complaints.

B GROUP – LEFT BEHIND

  • This category comprises stocks that don’t fall in any of the other groups.
  • These counters see normal volumes and are settled under the rolling system. In all respects these stocks resemble their counterparts in ‘A’ but for their size. Typically, stocks of mid- and small market capitalisation come under this grade.

SLB GROUP 

Securities Exchange Board of India, in 2007, has announced the introduction of Securities Lending & Borrowing Scheme (SLBS). Securities Lending & Borrowing provides a platform for borrowing of securities to enable settlement of securities sold short. There are 207 companies in the SLB list. Investors can sell a stock which he/she does not own at the time of trade. All classes of investors, viz., retail and institutional investors, are permitted to short sell.

OTHER CLASSIFICATIONS

  • The “F” Group represents the Fixed Income Securities.
  • Trading in Government Securities by the retail investors is done under the “G” group.
That’s about stock classifications in BSE.
When you invest, be aware of the category in which the stock falls.
have a nice day !!

THE WEEK AHEAD

The week ahead: Waiting for the RBI meet.


The Indian stock markets witnessed strong sell off on Monday. The Indian investors played on a cautious note since January 28th will witness the third monetary policy meeting of RBI since the new governor took charge. All eyes are on Mr.Raghuram Rajan who has earlier surprised the markets by acting contrary to expectations. Financial problems in Argentina, fears of slowdown in china and decision of the Federal Open Market Committee have only added more confusion and risk aversion across the globe. With the rupee trading above Rs 63 to a dollar, it would be interesting to see how the RBI chief is going to handle the whole situation. The stock markets would move according to the stance taken by the RBI on Tuesday.The RBI is unlikely to change the interest rates tomorrow, according to many experts. Maintaining status quo on interest rates or hiking the rate will result in the stock market plunging further and this can be utilized for picking fundamentally good stocks, especially from the banking sector. Stocks from the banking sector are likely to be hit hard if the policy review results in negative response. The benchmark indices – the sensex and the nifty- closed at 20,707 and 6,135 on Monday evening with an approximately 2% loss.